-
Metrics for Multi-label classificationData/Machine learning 2021. 5. 3. 12:01
AUC (Area Under the Curve)
[1] developers.google.com/machine-learning/crash-course/classification/roc-and-auc?hl=ko
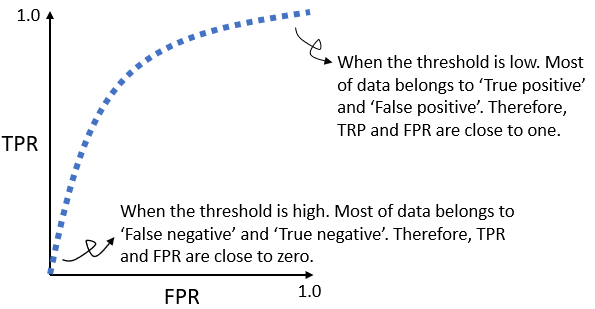
The area under the ROC (receiver operating characteristic) curve. The ROC curve consists of TPR (True Positive Rate) and FPR (False Positive Rate) :
$$ TPR = \frac{TP}{TP + FN} $$
$$ FPR = \frac{FP}{FP + TN} $$

The ROC curve can be drawn by adjusting a classification threshold from zero to one. Generally, the low threshold leads to higher TPR and FPR, and vice versa:

AUC is computed by $\int_{0}^{1} ROC curve$. Its values can vary between zero (min) and one (max).
Micro-average vs. Macro-average
[1] StackExchange, "Micro Average vs Macro average Performance in a Multiclass classification setting" (link).
The micro-averaging is subject to a number of samples per class, while the macro-averaging is invariant to it.
Example
Let's compute precisions of the following resulting data by micro-averaging and macro-averaging:
TP FP Class A 1 1 Class B 10 90 Class C 1 1 Class D 1 1 Then, the precisions are: $Pr_A = Pr_C = Pr_D = 0.5$, whereas $Pr_B = 0.1$. Then, the micro-averaging and macro-averaged precisions are computed as:
$$ Pr_{micro} = \frac{1+10+1+1}{2+100+2+2} = 0.123 $$
$$ Pr_{macro} = \frac{0.5 + 0.1 + 0.5 + 0.5}{4} = 0.4 $$
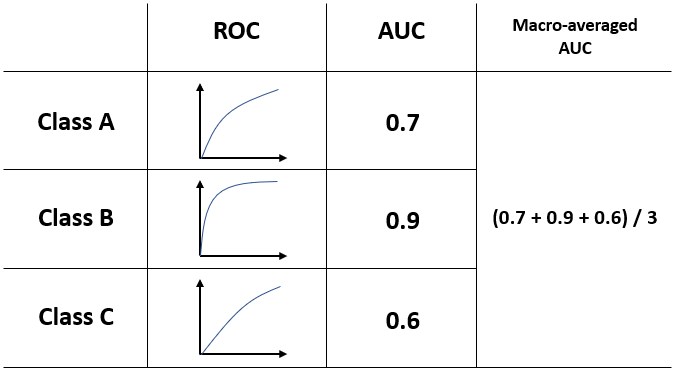
Example of Micro-averaged AUC

This metrics is used in [N. Strodthoff et al., 2020, "Deep learning for ECG analysis: Benchmarks and insights from PTB-XL"]. 
source: https://scikit-learn.org/stable/auto_examples/model_selection/plot_roc.html#sphx-glr-auto-examples-model-selection-plot-roc-py Metrics for Multi-label Classification
[1] Mustafa Murat ARAT, "Metrics for Multilabel Classification" (link)
'Data > Machine learning' 카테고리의 다른 글
Loss function for multi-label classification (0) 2021.05.03 PyTorch Example of LSTM (0) 2021.04.21 Log-bilinear Language Model (0) 2021.04.20