-
Distance MetricsData/Machine learning 2021. 1. 11. 17:09
Similarity (nearness) is determined using a distnace metric, which is a function that measures how far two records $(x_1, x_2, \cdots, x_p)$ and $(u_1, u_2, \cdots, u_p)$.
Euclidean Distance
$$ \sqrt{(x_1 - u_1)^2 + (x_2 - u_2)^2 + \cdots + (x_p - u_p)^2} $$
Manhattan Distance
$$ |x_1 - u_1| + |x_2 - u_2| + \cdots + |x_p - u_p| $$
The Manhattan distance is the distance between two points traversed in a single direction at a time (e.g., travelin galong rectangular city blocks).
Other Distance Metrics
Mahalanobis Distance
According to this Youtube video, the Mahalanobis distance can be summarized as follows: An improved version of Euclidean distance considering the covariance between two variables (if the covariance matrix is the identity matrix, the Mahalanobis distance is the same as the Euclidean distance).
Limitation of the Euclidean distance

According to the Euclidean distance, $d(red, \mu)$ is equal to $d(blue, \mu)$ where $\mu$ is marked by a cross. However, it is obvious that the red data point is a kind of an outlier, so $d(red, \mu) > d(blue, \mu)$ should be the case. The Mahalanobis distance computes the Euclidean distance considering the covariance between two variables.
Formal Equation
The Mahalanobis distance can be defined as a dissimilarity measure between two vectors $\boldsymbol{x}$ and $\boldsymbol{u}$ of the same distribution with the covariance matrix $\boldsymbol{\Sigma}$.
$$ d(\boldsymbol{x}, \boldsymbol{u}) = \sqrt{ (\boldsymbol{x} - \boldsymbol{u})^T \boldsymbol{\Sigma}^{-1} (\boldsymbol{x} - \boldsymbol{u}) } $$
Example
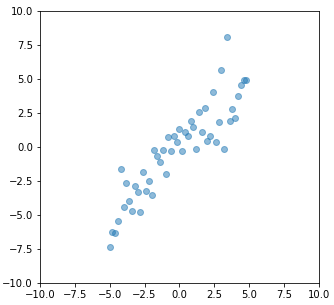
Example dataset The example dataset has the correlation matrix $\boldsymbol{\Sigma} = \begin {bmatrix} 8.5 & 7.64 \\ 7.64 & 8.8 \end{bmatrix}$ (positive correlation) computed by
np.cov(dataset.T). If we compare $d([2,2], [-2, -2])$ and $d([-2,2], [2, -2])$, then $d([2,2], [-2, -2])$ should be smaller than $d([-2,2], [2, -2])$ in terms of the Mahalanobis distance given that the dataset has a positive correlation.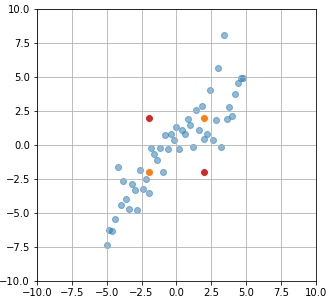
The yellow data points should be closer than the red in terms of the Mahalanobis distance Computing the Mahalanobis distances between the yellow data points and the red:
$$d([2,2], [-2, -2]) = 1.4$$
$$d([-2,2], [2, -2]) = 5.65$$
computed by
scipy.spatial.distance.mahalanobis(...)It proves the fact that the Mahalanobis considers the covariance for the distance calculation. An additional example can be found here.
'Data > Machine learning' 카테고리의 다른 글
The Boosting Algorithm (0) 2021.01.12 Problems with Clustering Mixed Data (0) 2021.01.10 Gower's Distance (0) 2021.01.08