-
[Kalman filter] code, exampleMathematics 2020. 9. 10. 17:22
아래 예제는 https://pinkwink.kr/781 와 유사합니다.
아래 KalmanFilter class 코드는 https://github.com/zziz/kalman-filter 에서 약간의 수정을 하였습니다.
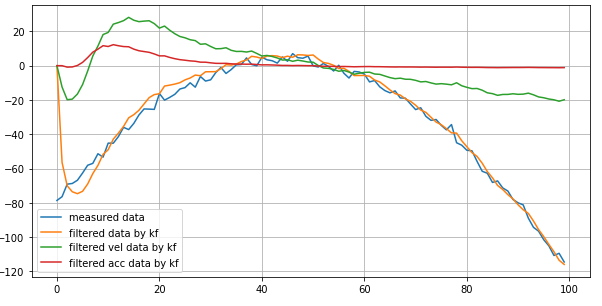
import numpy as np

class KalmanFilter(object):
    def __init__(self, F = None, B = None, H = None, Q = None, R = None, P = None, x0 = None):
        """
        F(=A) [nxn]: system matrix that releates the state at k-1 to the state at step k
        B [nx1]: it relates the control input(u_k) to the state(x_k)

        H [mxn]: matrix that relates the state to the measurement


        Q: process noise covariance. It represents the uncertainty in the process or model
        R: measurement noise covariance. It represents the unvertainty in the measurement

        P: error covariance.
        x0: initial state
        """
        if(F is None or H is None):
            raise ValueError("Set proper system dynamics.")

        self.n = F.shape[1]
        self.m = H.shape[1]

        self.F = F
        self.H = H
        self.B = 0 if B is None else B
        self.Q = np.eye(self.n) if Q is None else Q
        self.R = np.eye(self.n) if R is None else R
        self.P = np.eye(self.n) if P is None else P
        self.x = np.zeros((self.n, 1)) if x0 is None else x0

    def predict(self, u = 0):
        self.x = np.dot(self.F, self.x) + np.dot(self.B, u)
        self.P = np.dot(np.dot(self.F, self.P), self.F.T) + self.Q
        return self.x

    def update(self, z):
        y = z - np.dot(self.H, self.x)
        S = self.R + np.dot(self.H, np.dot(self.P, self.H.T))
        K = np.dot(np.dot(self.P, self.H.T), np.linalg.inv(S))
        self.x = self.x + np.dot(K, y)
        I = np.eye(self.n)
        self.P = np.dot(np.dot(I - np.dot(K, self.H), self.P),
            (I - np.dot(K, self.H)).T) + np.dot(np.dot(K, self.R), K.T)


if __name__ == '__main__':
    # example
    import matplotlib.pyplot as plt

    # get data
    x = np.linspace(-10, 10, 100)
    measurements = - (x**2 + 2*x - 2)  + np.random.normal(0, 2, 100)

    # params for kalman filter
    dt = x[1] - x[0]

    F = np.array([[1, dt, 0],
                  [0, 1, dt],
                  [0, 0, 1]])

    H = np.array([1, 0, 0]).reshape(1, 3)

    Q = np.array([[0.05, 0.05, 0.0],
                  [0.05, 0.05, 0.0],
                  [0.0, 0.0, 0.0]])

    R = np.array([0.5]).reshape(1, 1)

    # define kf
    kf = KalmanFilter(F = F, H = H, Q = Q, R = R)

    # predict
    predictions = []
    for z in measurements:
        predictions.append( kf.predict().ravel() )
        kf.update(z)
    predictions = np.array(predictions)

    # plot
    plt.figure(figsize=(10, 5))
    plt.plot(measurements, label = 'measured data')
    plt.plot(predictions[:, 0], label = 'filtered data by kf')
    plt.plot(predictions[:, 1], label = 'filtered vel data by kf')
    plt.plot(predictions[:, 2], label = 'filtered acc data by kf')
    plt.legend()
    plt.grid()
    plt.show()
output:
'Mathematics' 카테고리의 다른 글
Fuzzy System - tutorial.pdf, code (0) 2020.09.10 iterative mean, std (standard deviation) (0) 2020.09.10 Global to Local coordinate, Local to Global coordinate (0) 2020.09.10