Outlier Detection with Multivariate Normal Distribution
Let's say, we have a dataset with two random variables that follow the normal distribution:

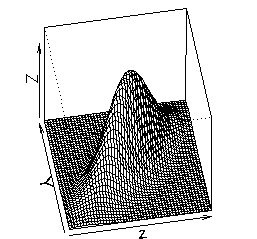
Then, we can build a 2-dimensional normal distribution that fits the above dataset:
The probability contour would look like that:

Since we usually consider data outside of the 95% confidence level as an outlier, we can set the boundary between non-outliers and outliers as an ellipse with the probability of 0.05.
You should note that people do not commonly use $p$-value here for purposes like ours or hypothesis tests. The $p$-value corresponding to a coordinate $(T_1, T_2)$ in the two-dimensional normal distribution is defined as follows (source: here):

The $p$-value in this situation is not particularly meaningful. What is commonly used in this situation is something like this:

where the measure of the orange region is now the probability that a random point would have been "less likely" (e.g. have a lower probability density) than $(T_1, T_2)$.
Source: here